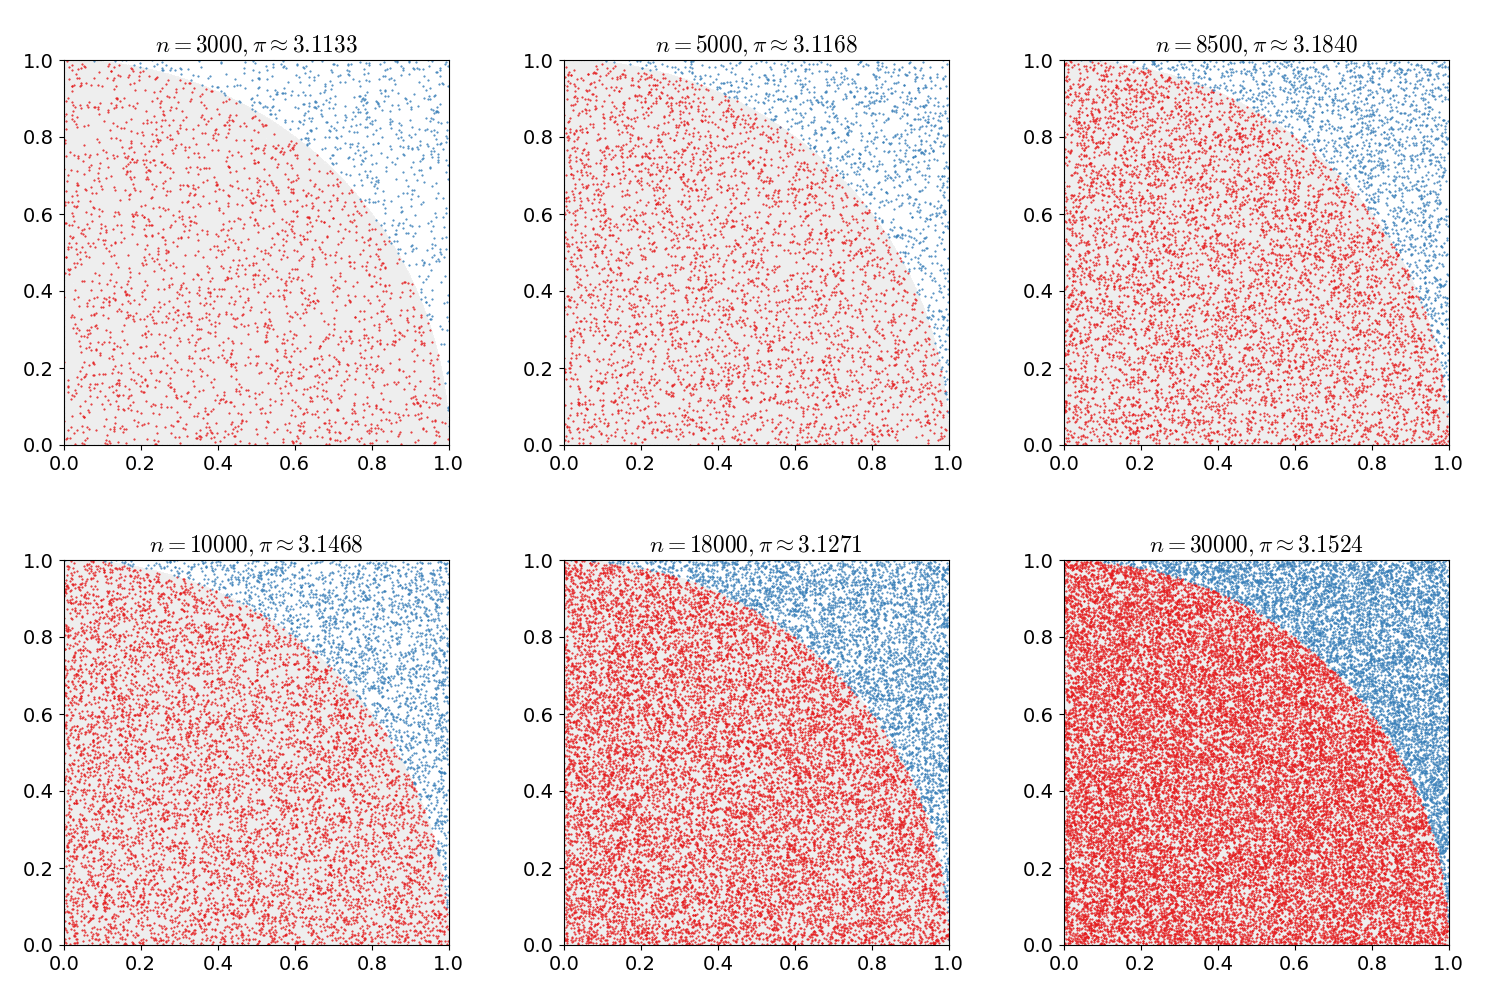
ملف:Pi 30K.gif
Pi_30K.gif (500 × 500 بكسل حجم الملف: 476 كيلوبايت، نوع MIME: image/gif، ملفوف، 10 إطارات، 2٫0ث)
تاريخ الملف
اضغط على زمن/تاريخ لرؤية الملف كما بدا في هذا الزمن.
| زمن/تاريخ | صورة مصغرة | الأبعاد | مستخدم | تعليق | |
|---|---|---|---|---|---|
| حالي | 16:00، 16 فبراير 2017 |  | 500 × 500 (476 كيلوبايت) | Nicoguaro | Make the plot square and increase gif delay. |
| 15:38، 16 فبراير 2017 |  | 640 × 480 (476 كيلوبايت) | Nicoguaro | Bigger text in the axes, and colors from ColorBrewer. Code in Python. | |
| 18:29، 7 نوفمبر 2011 |  | 500 × 500 (373 كيلوبايت) | Rayhem | Slowed animation to avoid looking like a blinky page element, improved resolution, added counter for number of points, shaded points inside/outside the circle. ==Mathematica 7.0 Source== <pre> tinyColor[color_, point_] := {PointSize[Small], color, Point[ | |
| 23:12، 14 مارس 2011 |  | 360 × 369 (363 كيلوبايت) | CaitlinJo | {{Information |Description ={{en|1=As points are randomly scattered inside the unit square, some fall within the unit circle. The fraction of points inside the circle over all points approaches pi as the number of points goes toward infinity. This ani |
استخدام الملف
الصفحة التالية تستخدم هذا الملف:
الاستخدام العالمي للملف
الويكيات الأخرى التالية تستخدم هذا الملف:
- الاستخدام في be.wikipedia.org
- الاستخدام في bg.wikipedia.org
- الاستخدام في ca.wikipedia.org
- الاستخدام في da.wikipedia.org
- الاستخدام في el.wikipedia.org
- الاستخدام في en.wikipedia.org
- الاستخدام في en.wikibooks.org
- الاستخدام في eo.wikipedia.org
- الاستخدام في eu.wikipedia.org
- الاستخدام في fa.wikipedia.org
- الاستخدام في fr.wikipedia.org
- الاستخدام في he.wikipedia.org
- الاستخدام في hi.wikipedia.org
- الاستخدام في id.wikipedia.org
- الاستخدام في it.wikipedia.org
- الاستخدام في ja.wikipedia.org
- الاستخدام في ko.wikipedia.org
- الاستخدام في pt.wikipedia.org
- الاستخدام في sh.wikipedia.org
- الاستخدام في simple.wikipedia.org
- الاستخدام في sl.wikipedia.org
- الاستخدام في sr.wikipedia.org
- الاستخدام في sv.wikipedia.org
- الاستخدام في ta.wikipedia.org
- الاستخدام في test.wikipedia.org
- الاستخدام في th.wikipedia.org
- الاستخدام في tr.wikipedia.org
- الاستخدام في uk.wikipedia.org
- الاستخدام في vi.wikipedia.org
- الاستخدام في www.wikidata.org
- الاستخدام في zh-yue.wikipedia.org
- الاستخدام في zh.wikipedia.org
