ملف:Mauna Loa Carbon Dioxide-en.svg

الملف الأصلي (ملف SVG، أبعاده 850 × 547 بكسل، حجم الملف: 16 كيلوبايت)
| هذا ملف من ويكيميديا كومنز. معلومات من صفحة وصفه مبينة في الأسفل. كومنز مستودع ملفات ميديا ذو رخصة حرة. |
ملخص
| الوصف |
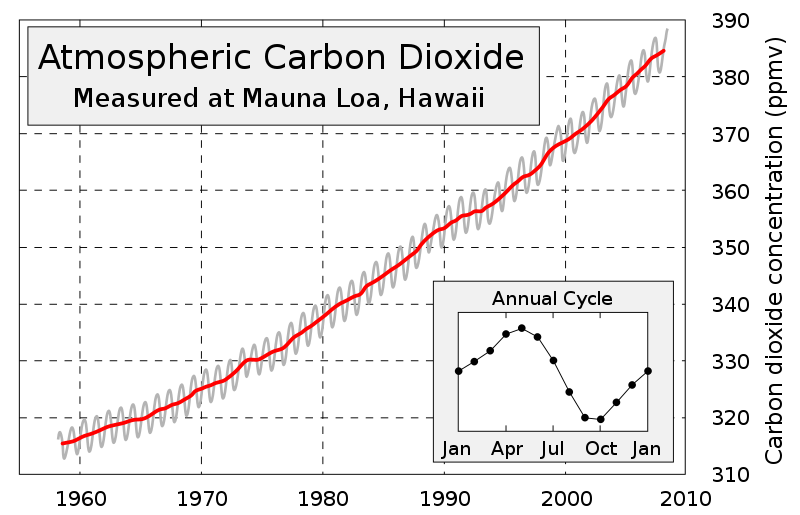
English: This figure shows the history of atmospheric carbon dioxide concentrations as directly measured at Mauna Loa, Hawaii. This curve is known as the Keeling curve, and is an essential piece of evidence of the man-made increases in greenhouse gases that are believed to be the cause of global warming. The longest such record exists at Mauna Loa, but these measurements have been independently confirmed at many other sites around the world [1].
The annual fluctuation in carbon dioxide is caused by seasonal variations in carbon dioxide uptake by land plants. Since many more forests are concentrated in the Northern Hemisphere, more carbon dioxide is removed from the atmosphere during Northern Hemisphere summer than Southern Hemisphere summer. This annual cycle is shown in the inset figure by taking the average concentration for each month across all measured years. The grey curve shows the average monthly concentrations, and red curve is a moving 12 month average.Français : Évolution de la teneur atmosphérique en dioxyde de carbone, mesurée depuis le volcan Mauna Loa, dans l'île de Hawaii. La courbe de cette évolution est connue sous le nom de « courbe de Keeling », et est une preuve évidente de la production humaine de gaz à effet de serre et de son impact sur le réchauffement climatique. C'est sur le Mauna Loa que les taux mesurés sont les plus élevés, mais on retrouve la même évolution sur d'autres sites dans le monde (voir ici).
La fluctuation annuelle de dioxyde de carbone est dûe aux variation saisonnière causées par les plantes. Comme beaucoup de forêts se trouvent dans l'hémisphère nord, il y a plus de rejet de gaz carbonique dans l'atmosphère durant l'été septentrional que pendant l'été austral. Ce cycle annuel est indiqué dans l'encart en bas à droite de l'image, et montre la concentration moyenne de gaz au cours des différents mois. Ce cycle se répète quelle que soit l'année observée. La courbe grise montre la teneur moyenne mensuelle de dioxyde de carbone, et la courbe rouge représente la moyenne annuelle. |
||
| التاريخ | |||
| المصدر | Image:Mauna Loa Carbon Dioxide.png, uploaded in Commons by Nils Simon under licence GFDL & CC-NC-SA ; itself created by Robert A. Rohde from NOAA published data and is incorporated into the Global Warming Art project. | ||
| المؤلف | Sémhur | ||
| إصدارات أخرى |
[]
Updated version (2015)
| ||
| نسب العمل لمُؤَلِّفه (required by the license) | © Sémhur / Wikimedia Commons / | ||
| SVG | W3C-validity not checked. .هذا الرسم المتجهي أُنشئ بواسطة Inkscape
|
||
| Graphic Lab |

| موقع آلة التصوير | | هذه وغيرها من الصور في مواقعها على: خريطة الشارع المفتوحة |
|---|
ترخيص
| الحقوق المتروكة: هذا العمل الفني حُرٌّ، بإمكانك إعادة نشره وتعديله وفقاً لشروط رخصة العمل الفني الحرُّ. ستجد على عينة من هذه الرخصة في موقع الويب المخصص للحقوق المتروكة، وكذلك في المواقع الأخرى. |
- يحقُّ لك:
- مشاركة العمل – نسخ العمل وتوزيعه وبثُّه
- إعادة إنتاج العمل – تعديل العمل
- حسب الشروط التالية:
- نسب العمل إلى مُؤَلِّفه – يلزم نسب العمل إلى مُؤَلِّفه بشكل مناسب وتوفير رابط للرخصة وتحديد ما إذا أجريت تغييرات. بالإمكان القيام بذلك بأية طريقة معقولة، ولكن ليس بأية طريقة تشير إلى أن المرخِّص يوافقك على الاستعمال.
- الإلزام بترخيص المُشتقات بالمثل – إذا أعدت إنتاج المواد أو غيرت فيها، فيلزم أن تنشر مساهماتك المُشتقَّة عن الأصل تحت ترخيص الأصل نفسه أو تحت ترخيص مُتوافِقٍ معه.
تاريخ الملف
اضغط على زمن/تاريخ لرؤية الملف كما بدا في هذا الزمن.
| زمن/تاريخ | صورة مصغرة | الأبعاد | مستخدم | تعليق | |
|---|---|---|---|---|---|
| حالي | 10:19، 29 يونيو 2008 | | 850 × 547 (16 كيلوبايت) | Sémhur | clean-up |
| 09:30، 27 يونيو 2008 |  | 850 × 547 (31 كيلوبايت) | Sémhur | Data updated (now, from 1958 to june 2008) | |
| 13:51، 23 أبريل 2008 |  | 800 × 547 (33 كيلوبايت) | Sémhur | Without the bitmap, it's better | |
| 13:48، 23 أبريل 2008 |  | 800 × 547 (33 كيلوبايت) | Sémhur | {{Information |Description= {{en|This figure shows the history of atmospheric carbon dioxide concentrations as directly measured at Mauna Loa, Hawaii. This curve is known as the [ |
استخدام الملف
الصفحتان التاليتان تستخدمان هذا الملف:
الاستخدام العالمي للملف
الويكيات الأخرى التالية تستخدم هذا الملف:
- الاستخدام في af.wikipedia.org
- الاستخدام في en.wikipedia.org
- الاستخدام في fr.wikipedia.org
- الاستخدام في ko.wikipedia.org
- الاستخدام في zh.wikipedia.org