ملف:Estradiol during menstrual cycle.png
الملف الأصلي (3٬682 × 1٬640 بكسل حجم الملف: 492 كيلوبايت، نوع MIME: image/png)

ملخص

الوصف
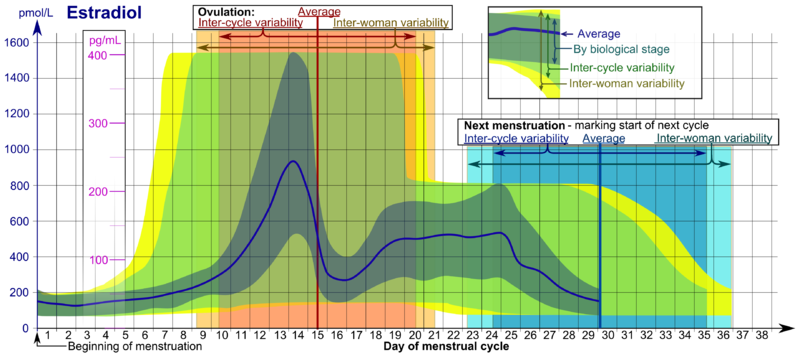
English: Reference ranges for the blood content of estradiol during the menstrual cycle.


Interpretation

The time scale starts with the beginning (or "onset") of (last) menstrual period (LMP), given as day number. Day number 1 corresponds to 0 to 0.99 days from LMP, and Day number 2 corresponds to 1.00 to 1.99 days from LMP and so forth. The time scale ends at whatever is the actual next menstruation, which marks the beginning of the next cycle, which is equivalent to starting all over again from the beginning of the time scale.

  • Inter-cycle (also called within-woman or intrawoman) variability for ovulation and next menstruation are the 95% prediction intervals for the timing of these events in any single woman, assuming an inter-cycle average duration that is equal to population average.
  • Inter-woman variability for ovulation and next menstruation are the 95% prediction intervals for the timing of these events in the overall population.

Hormone levels represent usual ones, not necessarily related to what is healthy. Hormone ranges vary between cases at the same biological stage of the menstrual cycle. Furthermore, the actual timing (usually given in day numbers from mentruation) of that biological stage varies, both between cycles of any single woman (inter-cycle) and between somen (inter-woman). Therefore, the appropriate ranges to use depend on how certain the actual biological stage can be estimated at any time.

  • The ranges denoted By biological stage are the 90% prediction intervals for hormone levels for women at the same biological stage. These reference ranges may be used in closely monitored menstrual cycles in regard to other markers of its biological progression, with the time scale being compressed or stretched to how much faster or slower, respectively, the cycle progresses compared to an average cycle. In the luteal phase, a known time of ovulation is sufficient to use these ranges.
  • The ranges denoted Inter-cycle variability (also called within-woman or intrawoman variability) are the up to 95% prediction intervals for any single woman, assuming an inter-cycle average duration that is equal to population average. These ranges are more appropriate to use in non-monitored cycles with only the beginning of menstruation known, but where the woman accurately knowing her average cycle lengths and time of ovulation, and that they are somewhat averagely regular, with the time scale being compressed or stretched to how much a woman's average cycle length is shorter or longer, respectively, than the average of the population.
  • The ranges denoted Inter-woman variability are the up to 95% prediction intervals for hormone levels in the overall population. These ranges are more appropriate in non-monitored cycles, where the average cycle lengths and time of ovulation are unknown, but only the beginning of menstruation is given.

Derivation

See source article:

التاريخ
المصدر

عمل شخصي.

Hormones estradiol, progesterone, LH and FSH during menstrual cycle.svg
For ease of keeping the x-axis vertically consistent within the image series, all the images in this series are derived from one common vector image: File:Hormones estradiol, progesterone, LH and FSH during menstrual cycle.svg (made using Inkscape).
المؤلف

Mikael Häggström

This image can be cited as:

إصدارات أخرى
هذه biology الصورة / الصورتان باستعمال رسومات متجهية ملفات رسوميات شعاعية. It is recommended to name the SVG file "Estradiol during menstrual cycle.svg" - then the template Vector version available (or Vva) does not need the new image name parameter.

ترخيص

Public domain أنا، مالِك حقوق تأليف ونشر هذا العمل، أجعله في النِّطاق العامِّ، يسري هذا في أرجاء العالم كلِّه.
في بعض البلدان، قد يكون هذا التَّرخيص غيرَ مُمكنٍ قانونيَّاً، في هذه الحالة:
أمنح الجميع حق استخدام هذا العمل لأي غرض دون أي شرط ما لم يفرض القانون شروطًا إضافية.

الشروحات

أضف شرحاً من سطر واحد لما يُمثِّله هذا الملف
A graph of the reference ranges for the blood content of estradiol during the menstrual cycle.

العناصر المصورة في هذا الملف

يُصوِّر

٢٢ يناير 2011

تاريخ الملف

اضغط على زمن/تاريخ لرؤية الملف كما بدا في هذا الزمن.

زمن/تاريخصورة مصغرةالأبعادمستخدمتعليق
حالي14:03، 22 يناير 2011تصغير للنسخة بتاريخ 14:03، 22 يناير 20113٬682 × 1٬640 (492 كيلوبايت)Mikael HäggströmSome fixes
07:23، 22 يناير 2011تصغير للنسخة بتاريخ 07:23، 22 يناير 20114٬279 × 1٬640 (524 كيلوبايت)Mikael Häggström{{Information |Description={{en|1=Estradiol {{Description of menstrual cycle diagrams}}}} |Source={{own}} |Author=Mikael Häggström |Date=2011-01-22 |Permission= |other_versions= }}

الصفحتان التاليتان تستخدمان هذا الملف:

الاستخدام العالمي للملف

الويكيات الأخرى التالية تستخدم هذا الملف: